Fish kills reported – help us track them!

One of our citizen scientists used Woods Hole Group’s fish mortality reporting system to notify us of a recent fish kill here in Falmouth, MA.  Turns out she wasn’t the only one to notice the 16 dead striped bass washed up on the shores of Little Pond (see Cape Cod Times and Falmouth Enterprise).

While local officials and scientists are confident in their assessment that this event on Little Pond resulted from low dissolved oxygen levels (due to area septic system nitrogen inputs spurring an algae bloom), we are less sure about the cause of other fish kills that have occurred in the region.

For this reason, we have developed an iPhone app and a voice/text reporting system to track these events and hopefully obtain fresh samples for analysis.  We’ve already fielded a handful of reports so far this year, one of which yielded a bluefish for necropsy by our team of researchers.  As we collect more data, we hope to get to the bottom of this disconcerting phenomenon.  So, please, be our eyes out on the water this summer – download the mCrowd app (‘Buzzards Bay Fish Mortality’ is a task within this app) and become a citizen scientist.

Posted in environment, ocean | Tagged , , , , , , , , , | 3 Comments

New York CitiVision raises awareness of sea-level rise

What would a Friday be without some fatidic architectural renderings?  The New York CitiVision competition asked the question “If the future is gone, what past is expecting us?”, pressing designers to think about what the future city might look like if a critical choice had been made differently or how it might adapt to an already compromised future.

The responses run the gamut from eutopian to dystopian, but what is really notable to us is that sea-level rise seems to be on the collective consciousness.  We’ll chalk up the accuracy of sea-level representations to artistic license, and be thankful that designers are thinking about how cities could adapt to rising seas – however fanciful the adaptation.

Here are a few relevant entries, click the picture for more details, and let your imagination run wild:

Posted in climate change, flooding, planning, sea-level rise | Tagged , , , , , , , , | 1 Comment

Happy World Oceans Day!

One of the largest natural resources on earth is also one of its most threatened.  Take a moment today – World Oceans Day – to reflect on the myriad services oceans provide us, and how our daily lives in turn affect these waters.

We encourage you to make the Ocean Project’s Seven C’s Pledge to learn how you can contribute to the protection and conservation of ocean resources:

  1. Commit to Making a Real Difference
  2. Conserve in My Home
  3. Challenge Myself Daily
  4. Consume Consciously
  5. Connect in My Community
  6. Communicate My Interests and Concerns
  7. Celebrate Our Ocean

Since we’re based on Cape Cod, we offer here some relevant tips for preserving the coastal and marine waters of our region:

  • Take a walk along your local beach and pick up trash – marine debris is a major threat to the fish, birds and mammals of coastal and marine waters.
  • When boating, avoid anchoring, dragging, and propeller wash near submerged aquatic vegetation like eelgrass – these fragile ecosystems are highly productive critical habitat and major engines of carbon sequestration.
  • When fishing catch and release, use single barbless hooks (or pinch the barb with pliers) – minimizing injury to and handling time of fish helps maintain healthy stocks.
  • When visiting the beach, stay off the dunes and salt marsh grasses – these are critical habitat areas as well as buffers to the erosive action of waves and rising seas.
  • When shopping for seafood, ask for sustainably caught fish or join a community supported fishery – many of the world’s fisheries are over-fished and some fish farming methods impair coastal water quality.
  • If you have unused prescription or over-the-counter medications, dispose of them properly or seek out a drug take-back initiative in your area – pharmaceuticals released to the environment travel through groundwater and can persist in drinking water supplies or have adverse effects on aquatic life.
  • Limit or eliminate use of fertilizers on your yard – nitrates and phosphates from fertilizers get into estuaries via runoff and groundwater, causing algae blooms and low oxygen levels.
  • Walk, bike or carpool to work, school and extra-curricular activities as much as possible – oceans are a global carbon sink, but as they reach saturation they are acidifying and putting undue stress on marine life.
  • Take a walk along your local beach with Rachel Carson’s “The Edge of the Sea” in tow – it’s one of our favorites!

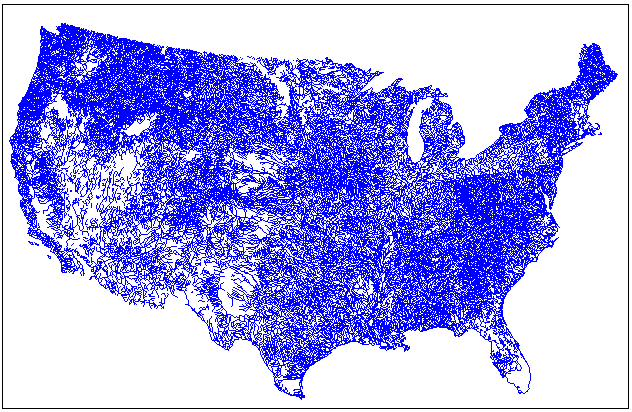
If you’re from an inland area, ask yourself how your life is tied to the ocean.  What products do you use or consume that are from the ocean?  How and where do your daily actions affect coastal and marine systems?  Take a look at the map – you’re bound to be connected to an ocean somehow!

Happy World Oceans Day, from all of us at Woods Hole Group!

Posted in climate change, environment, eutrophication, habitat, ocean, ocean acidification, pollution | Tagged , , , , , , , , , , , | Leave a comment

Woods Hole Group nourishment project nominated for “Best of the Best Restored Beaches”

Last year, Menauhant Beach – a nourishment project designed and permitted by Woods Hole Group for the Town of Falmouth – was among the winners of the American Shore & Beach Preservation Association’s (ASBPA) annual “Best Restored Beaches” contest.

This year, in celebration of its 10th anniversary, the ASBPA is running a “Best of the Best” contest to build awareness of the value of America’s restored beaches, and Menauhant is in the running in the Community Beaches category.

The Menauhant Beach restoration project was such a success because it:

  • reduced the potential for storm damage;
  • improved and expanded intertidal habitat;
  • improved public access;
  • enhanced recreational use of the beach;
  • demonstrated that regional sediment management can provide a balanced and sustainable source of sediments for restoration projects; and
  • reinstated Menauhant as a favorite local beach.

Vote here (early and often) for your favorite until April 27, 2012:

Posted in beaches, coastal erosion, environment, flooding, habitat, sediment management, shoreline erosion | Tagged , , , , , , , , , , , , , | Leave a comment

The ups and downs of sea level rise

Two intriguing articles released recently proving, once again, that there are two sides to every story.  As with many of the expected results of climate change, there will be winners and losers in the sea level rise story.

Sea Level Rise to Alter Economics of California Beaches

“Rising sea levels are likely to change Southern California beaches in the coming century, but not in ways you might expect.”

Rising seas don’t have to be bad news

“To this day, Provincetown continues to grow at the expense of the beaches to its south. And that process is likely to accelerate as rising sea level exacerbates erosion.”

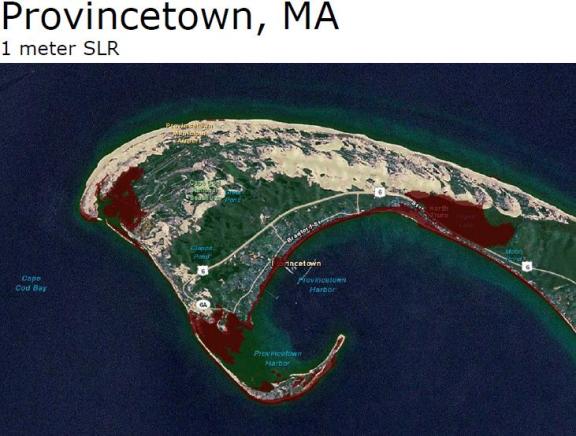
What’s interesting about these articles is the dichotomy of the effects of sea level rise – even at the same location.  For example, the very same California beach may lose significant beach-related revenues from “long-term losses in beach size caused by a 1-meter rise in sea level over the next 100 years” but may also experience increased beach-related revenues from “short-lived beach erosion resulting from a year of severe winter storms and high tides associated with sea level rise” due to losses from other beaches and shifted patterns of use.  Similarly, while sea level rise may be contributing to the accretion of the Providence hook, it is also threatening the infrastructure that serves it (see below figure of potential flooding of Routes 6 and 6A at Pilgrim Lake east of Provincetown):

Areas potentially impacted by sea level rise: Weiss JL, Overpeck JT, Strauss B (2011) Implications of recent sea level rise science for low-elevation areas in coastal cities of the conterminous U.S.A. Climatic Change DOI 10.1007/s10584-011-0024-x.

Posted in beaches, climate change, coastal erosion, environment, flooding, planning, sea-level rise, shoreline erosion | Tagged , , , , , , , , , | Leave a comment

A tale of two winters

It has been a busy winter here at Woods Hole Group.  Waking up this morning to a dusting of snow here on the Cape, we were reminded that this winter has also been a mild one.  And so we wondered if this milder winter has resulted in fewer and less intense storm-associated high water and wave events and, by extension, less shoreline erosion.

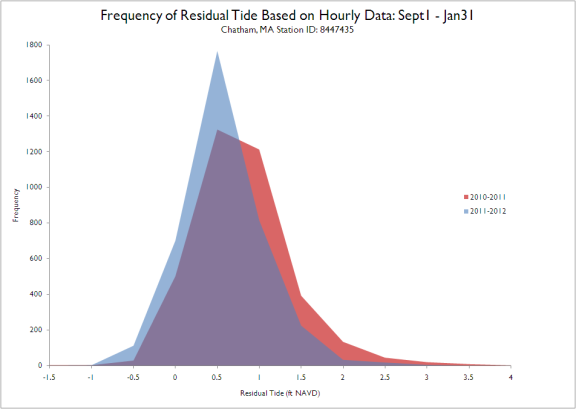
As a start, we decided to look at water levels by examining the residual tides at a nearby NOAA station between September 1 and January 31 of this winter and last winter.  Residual tide is the difference between the elevation of the observed water level and the elevation of the predicted water level.  NOAA makes tide predictions based on known factors that influence tidal height: gravitational pull of the moon and sun, coastal morphology, local water depth, and regional bathymetry.  These predictions also assume average weather conditions.  The observed water level may differ from the predicted water level when weather conditions are abnormal.  Prolonged onshore wind and low barometric pressure systems (i.e. storms) drive sea level higher than predicted, thus positive residual tides (observed exceeds predicted) are indicators of higher than average coastal storm activity.

Here is a look at the hourly residual tides for Chatham, MA (NOAA Station 8447435) for 2010-2011 (red) and 2011-2012 (blue):

It appears that there were a few more major storm events during 2010-2011 (red peaks) than during 2011-2012 (blue peaks).  Also, on average the residual tide during 2010-2011 (red line) was higher than during 2011-2012 (blue line), meaning there was a greater difference in observed vs. predicted water levels last winter than this winter.

Here’s another way to look a the data:

We see in this histogram that there was a lower frequency of larger residual tides in the 2011-2012 season than in the 2010-2011 season.  The shift in the curve from right to left (red to blue) indicates that storms affecting Chatham were less intense this winter than they were last winter.

We haven’t determined if these differences are significant, and a look further back into the historical record would provide a better perspective than this snapshot investigation, but the data are consistent with our anecdotal experience this winter.  Whether or not this relatively calm winter will spare our shoreline from excessive erosion remains to be seen.  Reports from some hotly contested cabins on Chatham’s North Beach Island indicate that so far, the seas have been merciful.

What has this winter brought to your area?  More storms or fewer storms?  More erosion or less erosion than usual?  Reports from the field are always welcome.

Posted in beaches, coastal erosion, flooding | Tagged , , , , , | 1 Comment

New sub-glacial map reveals Greenland’s conduit to the sea

Stunning data from the NASA Earth Observatory’s IceBridge program indicates that “Greenland’s Jakobshavn glacier has the potential to influence sea level rise more than any other single feature in the Northern Hemisphere.”

Looking Under Jakobshavn - November 10, 2011 NASA Earth Observatory Image of the Day

Detailed mapping of the bedrock below the fastest flowing glacier in the world revealed that a canyon the width and depth of the Grand Canyon funnels melting ice out to the Atlantic Ocean at a rate of 15 kilometers per year.  Understanding the dynamics of glacial beds allows researchers to better predict the rates of ice-loading to the ocean, which in turn allows them to refine estimates of future sea level rise.

Earth Observatory scientists hope to spin up their sea level rise projections based on this and other IceBridge evidence in time for the IPCC’s Fifth Assessment Report, due out in 2014.  We’re guessing that, based on NASA’s Greenland and Antarctica research and other developments, IPCC will revise the “0.18 to 0.59 meter by 2100” (from the Fourth Assessment Report) upward for 5AR.  Will it top the “1 meter by 2100” that is the current general consensus?  We’re on pins and needles…are you?

Posted in climate change, ocean, planning, sea-level rise | Tagged , , , , , , , , | Leave a comment

King tide a window to future, let’s document it!

King Tide to Raise Sea Level on Atlantic Coast – NYTimes.com.

A king tide will be running Wednesday and Thursday because gravitational forces of the sun, the moon and the earth will be lined up in a cue shot of fleeting geometry and rare power. It will raise the water level between one and two feet above normal high tides for many areas on the Atlantic coast. It’s an entirely natural phenomenon. This year, a network of scientists is asking members of the public to take pictures of the tides at their peak, and then again in a week, at their ordinary heights.

An extreme tide can give a telescopic view of a future with rising seas, when tides might routinely reach levels that they now get to only twice a year, said Kate Boicourt, an ecologist with the New York-New Jersey Harbor Estuary Program.

“What we’re seeing Wednesday and Thursday is probably what we normally will be seeing by 2080,” Ms. Boicourt said.

Looks like the highest tides will be occurring Thursday morning, so get out there with your camera and document the event.  It’s one thing to use computer rendering to visualize sea level rise and its effects on the coastline, but actual photographs of expected high water levels are much more powerful communication tools.

Check the tides for your area.  Take a photo of the king tide.  Take another photo from the same spot a week later at high tide to see the difference.

We are currently aware of the following organizations involved in regional king tide photo initiatives:

  • New York – New Jersey Harbor Estuary Program (email habitat@harborestuary.org)
  • Peconic Estuary Organization
  • Long Island Sound Study
  • Barnegat Bay Partnership
  • Partnership for the Delaware Estuary

In our region, Heather Goldstone of Climatide is collecting king tide photos.

Woods Hole Group will also collect any and all king tide photo sets and deliver them to the appropriate king tide photo initiative organizations.  Send your photos to info@whgrp.com and remember to note the location and time of each photograph.

flickr / brentbat (Brent Pearson)

Posted in beaches, climate change, coastal erosion, flooding, ocean, planning, sea-level rise, shoreline erosion | Tagged , , , , , , , , , , , | 2 Comments

Competition photo reveals Europe’s worst coastal erosion

About a month ago, we concluded our “Favorite New England Beach” Photo Contest.  Many of the submissions highlighted the combined effects of storms, coastal erosion, and sea-level rise on our precious coastal resources.

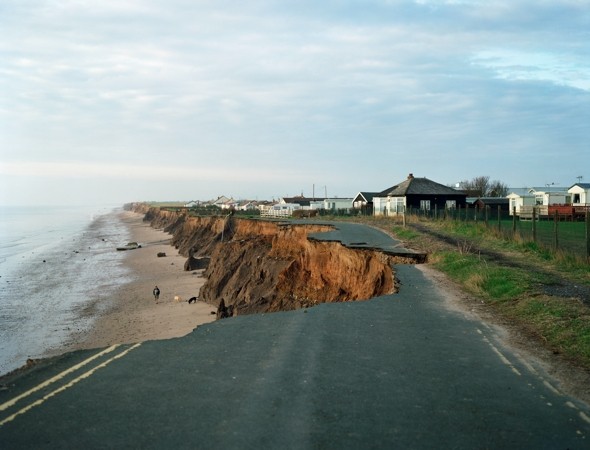
We just came across this article on the Environmental Photographer of the Year competition run by The Chartered Institution of Water and Environmental Management (CIWEM), and were struck by the this image from Yorkshire, England:

from ciwem.org

At approximately 6.5 ft/yr average long-term annual erosion, this stretch of the British coast is disappearing fast, but not quite as fast as some of our beaches in Massachusetts.  Food for thought.

Posted in beaches, climate change, coastal erosion, favorite New England beaches photo contest, sea-level rise, sediment management, shoreline erosion | Tagged , , , , , , , , , , | Leave a comment

Wetlands at a tipping point, coastal wetlands vulnerable

Status and Trends of Wetlands in the Conterminous United States 2004 to 2009.

courtesy of Lisa Brown

The latest U.S. Fish and Wildlife Service (USFWS) report documenting the losses and gains in wetland acreage came out earlier this month.  Commenting on the study’s findings, Secretary of the Interior Ken Salazar said:

“Wetlands are at a tipping point.  While we have made great strides in conserving and restoring wetlands since the 1950s…we remain on a downward trend that is alarming.  This report…should serve as a call to action to renew our focus on conservation and restoration efforts.”


Although the rate of total wetland gain (from restoration) increased 17% from the previous study (1998-2004), the rate of total wetland loss increased 140%.  This resulted in a net wetland loss of approximately 62,300 acres between 2004 and 2009.  Notable among the wetland types that experienced heavy losses in the conterminous U.S. recently were coastal wetlands, specifically estuarine intertidal emergent wetlands, which experienced a loss of 111,500 acres or 2.8%.  These wetlands underwent the highest percentage loss in the entire study, and the losses were three times greater than during the previous study period.  Interestingly, less than 1% of these estuarine losses are attributed to direct anthropogenic activity (Section 404 of the Clean Water Act in addition to state regulations protect them from being filled) while 99% are attributed to physical processes such as coastal storms, land subsidence, and sea-level rise.

These alarming trends highlight the importance of coastal wetlands restoration.

Woods Hole Group has been fortunate to have supported a number of salt marsh restoration projects, both large and small.  These restoration efforts provide important habitat for birds and fish, control invasive plant species, rebuild shellfish beds and restore natural flows of water throughout the system.  We are currently partnered with Massachusetts Division of Ecological Restoration to support wetlands restoration projects throughout the state.

A sampling of our wetlands restoration work:

  • 10,000 acres and counting for Delaware Bay Estuary Enhancement Program
  • 1,000 acres of salt marsh restoration in progress at Herring River in Welfleet, MA
  • 17 acres of wetland and historic herring run restoration completed on Stony Brook in Brewster, MA
Posted in coastal erosion, environment, habitat, wetlands | Tagged , , , , , | Leave a comment